Trailing 12 months, How to Read a Yahoo Finance Stock Chart
| Related Posts |
|---|
For the purposes of this blog post, I am currently using the Apple stock chart on Yahoo finance.com, as a reference for how to read a stock chart properly on Yahoo finance. There are many other websites that give data on stocks like this, such as Bloomberg, the Wall Street Journal, market watch and a host of other websites, but I personally think that Yahoo finance has the best layout for a basic level stock chart. With all this in mind, the trailing twelve months portion of the chart is the one that typically confuses people the most, in that it makes no sense at first glance. In this blog post, we will walk through the full meaning of TTM, and of how you can use it to help you pick stocks.
Trailing Twelve Months, Taking The Yahoo Finance Chart From The Top
From the top, if you Google the stock Apple, and search Yahoo finance after that, you will quickly notice that a chart showing the 50 day, 100 day, and 200 day moving averages appears. From here, you’ll see a long list of finance related stock terms, that probably don’t make a whole lot of sense to the average investor. This blog post’s goal is to walk through each one of these terms, and to explain to the layman, exactly what each one of these terms means.
Previous Close
The first on our list, is the previous close of the stock from the day before. In this case, I am currently looking at a stock chart that shows a 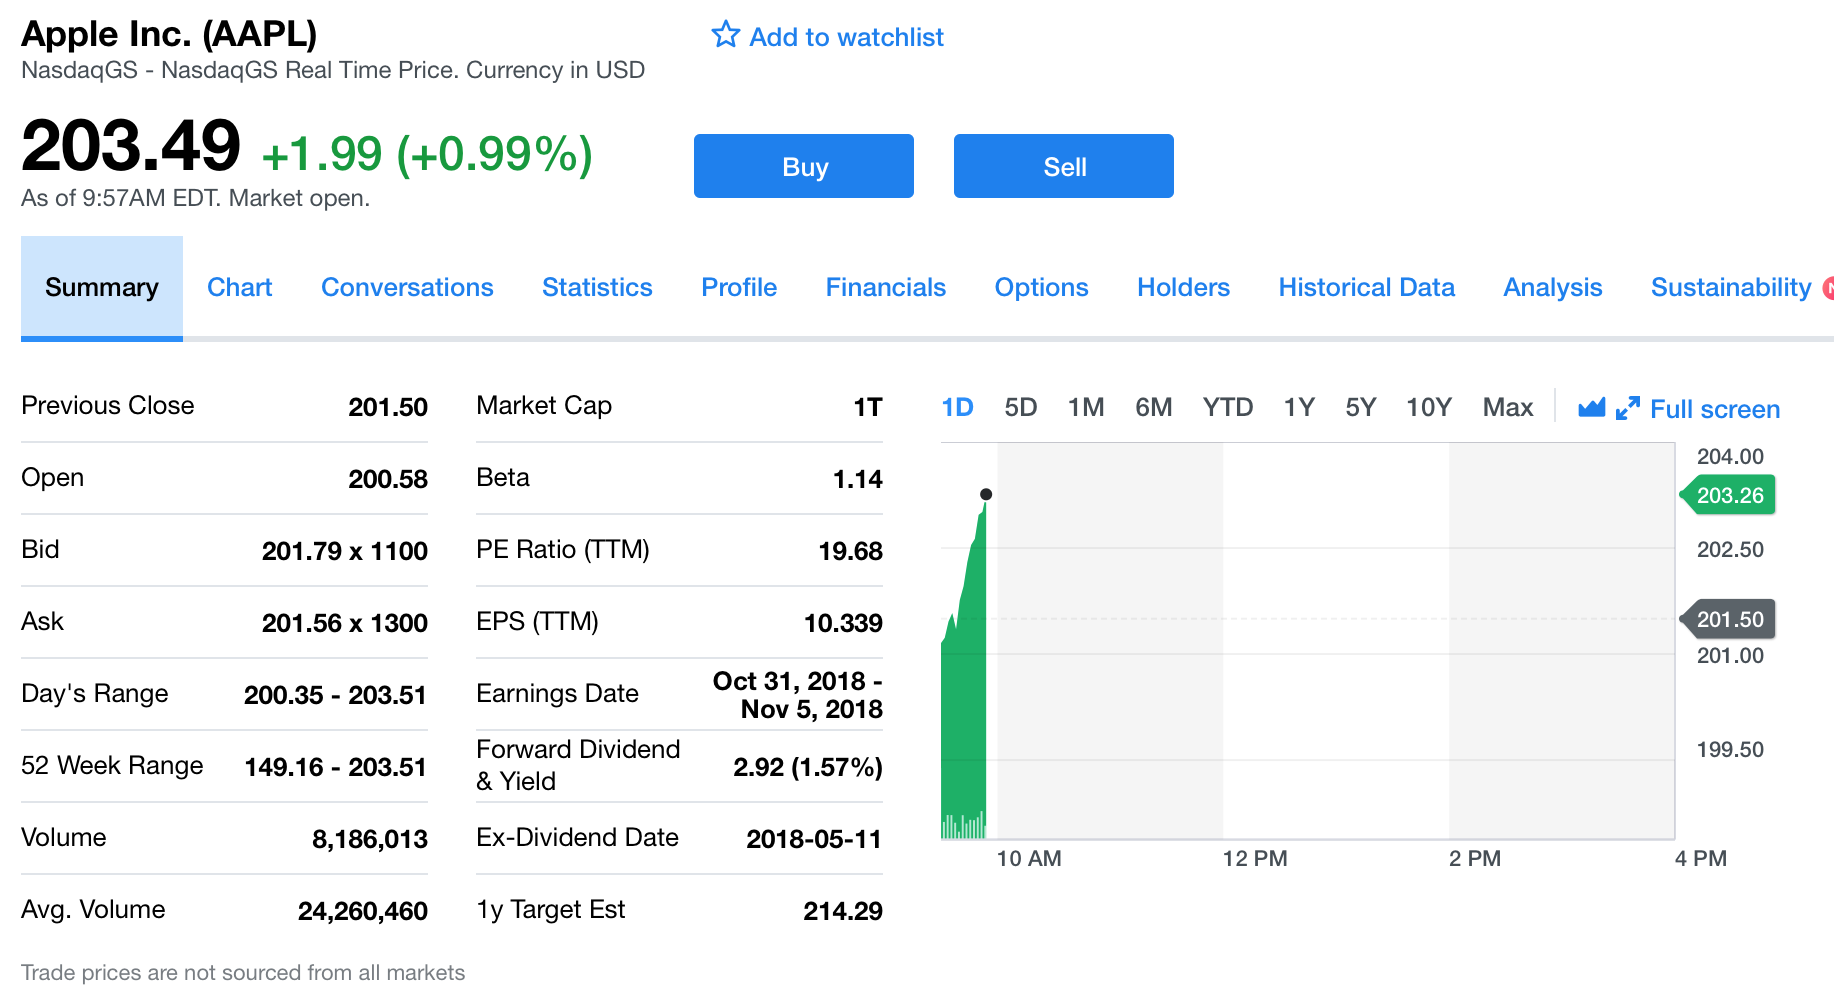 previous close of Apple at $302.92. What this means, is that the stock closed slightly below $303 at the prior close of trading day, which was 4 PM on Friday, the day that I am reading this article on Yahoo. Just below that, is a topic known as open, and shows the open price for the stock Apple. In this case, the open price for Apple today, was $305.64, so Apple lost about 1% on the stock exchange today.
The Bid Ask Spread
From here, the next section is one known as the bid ask spread, and shows a bid level at $310, And an asking price of $311. What this means, is that the broker is asking to sell you the stock for $311, and he’s allowing you to sell the stock back to him at $310. The one dollar difference is known as the spread, and is how the broker, the market maker, or what is commonly known as the middleman, makes his paycheck. If you have ever heard of the bid ask spread, this is what this is referring to. Then, we look at the days range, which shows a price range from $304, to $310 per share. What this means, is that throughout the day, the stock fluctuated between the $304, and the $310 range, while trading frequently on the stock exchange. The 52 week range below this, shows much the same thing, except for a period of a year, versus for a day like the one above that. Moving on past this, you’ll see that Apple has a volume of 33 million shares traded that day. What this means, is that the total number of shares bought and sold, of Apple, in a single day of trading, was 33 million exchanges of hands on the stock market for that day. Average volume is much the same, except takes into account a 52 week period, rather than for just the day.
Market Capitalization
Below this, you will see the market capitalization of the stock, which as of right now is $1.34 trillion, meaning that the total value of Apple as priced by the market, earnings multiple and all, is currently about $1.3 trillion. Given what is currently going on in the 2020 economy, with the horrible recession we are undergoing right now, this means that the company Apple, is a significant percentage of our economy, and it’s market cap is likely around 1 to 3% of our total GDP.
Final Thoughts on The Trailing Twelve Months Average, Why I Think Yahoo Finance Gives The Best Stock Chart Information
Moving on from this, you will see that Apple has a beta of 1.17, what this means is that Apple is only slightly riskier than that of the overall market. It also implies that it is almost exactly as risky as holding the S&P 500 in your portfolio. Prior to the recession, the beta of Apple was somewhere around the 1.35 mark, and my guess is that it has declined significantly, in that it has less systematic risk than a diversified portfolio, and since it has done well in this horrible economy. Below this, you will see the price to earnings multiple, the earnings per share multiple, and the earnings date. You’ll also notice that the PE ratio, and the earnings per share of the company, show the letters TTM, next to their label. What this means, is trailing twelve months, meaning that those ratios, are given as an average of the last 12 months of earnings of the company. To close out, the earnings date shows the next time that earnings are published for Apple, which would be the second quarter of 2020 earnings, and from here, the ex dividend date, is the last day that you can own the stock and still receive the dividend. And that’s the gist of it, I called this blog post Trailing Twelve Months, even though it is really about a lot more than that, in that it is the part of the Yahoo Finance Stock Chart that confuses people the most, and no one really knows what it is, so I felt it important to mention it in the post. Hope you enjoyed the blog post, and remember to subscribe for daily article updates sent straight to your news feed.
*Inflation Hedging.com
Sources:
https://www.bankrate.com/banking/cds/cd-rates/
https://money.cnn.com/data/markets/
Disclaimer: The opinions and documentation contained within this article and on this blog are the sole property of inflationhedging.com and are not to be copyrighted or reproduced in any manner, else legal action within the rights of the United States legal code could be use to obtain recompense. All articles and blog posts are the sole opinions of the writers of the blog, and are not necessarily in line with what exactly will work for you, you should consult a CPA, Tax Professional, or Financial Professional to determine what exact financial needs are in line with your interests. Also, from time to time, certain links on this website will be used to generate affiliate commissions, in order to support the health and growth of our website, health and business.


[…] to burn and as a result is giving back to its employees. This being said, Walmart currently has a PE ratio of 23.84, which in the retail industry is fairly high. The stock is overvalued right now, short-term the […]
[…] Trailing Twelve Months […]
[…] Previous Next What is a Variable Annuity? Why I Do Not Recommend Buying One […]