The 300 Day Moving Average, Technical Analysis At Its Finest
Before we get started with a new financial topic, I just wanted to say that I know chapter 4 might’ve had your head spinning a little bit. Don’t worry if you don’t know what every single concept is, or if you can’t rattle off what the return on assets means for a company from memory, just having exposure to these terms from reading the last chapter, as well as you having a reference guide to now turn to will be enough from that doozy of a glossary. Through repeated exposure to these types of terms, and through acquiring some base knowledge of what I’ll be talking about in later chapters of this book, it will begin to “click” for you, and you’ll be able to understand future concepts better. I am trying to make you an absolute financial magician by the end of this book, so keep on trucking with the continuing chapters, and just know that it will come full circle in the end, and that the concept as a whole will sink in thoroughly!
Why The 300 Day Moving Average is So Important
And now onto the meat, this is likely the chapter in this book that I’ve been looking forward to writing the most, in that not only are the actual technical factors that are used by technicians and day traders extremely interesting to me, but also because I get to absolutely hammer them with tons of research as to why their methods don’t work! What better thing on finance could there possibly be to write about?
With that said, let’s look into the gist of what technical analysis actually is, what it means, and of why I, and a lot of other employees on the street (as well as the majority of academic finance researchers) feel that it really doesn’t work well to generate alpha returns at all, and that you’re better off buying and holding a passively managed index fund consisting of all the stocks in the market. Technical analysis is essentially the use of chart patterns, momentum, moving averages, and other technical factors, including historic prices and the like, that are often times used in order to try and speculate which way a stock is going to move (notice how I said speculate, since that is essentially just what this is when you really get down to the meat and potatoes of it, a blind monkey betting on black at a Las Vegas Roulette table.)
Other Things to Think About Regarding Technical Analysis As a Whole
Technical analysis also typically relies on several flawed assumptions, which guide their skewed logic and push them to continue with these, practical “snake-oil” like tactics. The reasons why these are wrong include the following:
-
Expectations about future price movements are not determined by past ones
One of the fundamental assumptions of the technical analyst is that by using past stock-price movements, past volatility statistics, past P/E ratios, etc. that he or she can somehow use this to get an edge on the market and use it to predict future trades. This has been tried and tested time and time again, and while there is some evidence to suggest that momentum somewhat exists in the stock market, trading this almost always leads to failure, as whatever additional gains in stock prices that momentum may give a trader are typically outweighed by taxes and transaction fees.
-
You cannot get exact figures from projections (undetermined data) only a speculative guess
Most of the data in technical analysis (and even in fundamental analysis for that matter, as discounting future cash flows, and predicting future cash flows is a huge part of what fundamental analysis, also known as financial statement analysis entails – more on that in later chapters) is a speculative projection. Someone who is using past chart volatility rates, or past earnings multiples (another word for the P/E ratio of the stock, which literally stands for the Price to Earnings multiple) is essentially just using as much data as they can to come up with an educated guess of what a company’s cash flows, earnings, stock price movements, or price a stock is going to be quoted at at a specific date in time. Your guess is as good as the experts with regards to what Apple stock’s overall free cash flow is going to be for next quarter, research or no research.
-
What’s an effective P/E ratio for one stock may not be an effective P/E ratio for Another
This is absolutely true all-around. Although the mean P/E ratio for stocks over the last hundred or so years has been about 25, had you placed a short position on Amazon years and years ago when it was at a P/E ratio of 50, hoping for reversion to the mean, you would’ve lost likely your entire investment, as it now sits at a cool earnings multiple of 100+. While if you are a speculative trader, this is likely one of the biggest factors that you may use in determining the intrinsic value of a stock and is probably something that you regard as untimely advice. All evidence points to the opposite being the case, as even P/E ratios can sometimes catch you off guard, due to their vast differences in different sectors, different companies, etc. (This is a fundamental analysis ratio, not a technical analysis one, but the flawed assumption still holds strong.)
Here’s a look at some of the most popular chartist views on how the market works, and why both myself, and academic research, say that these likely don’t work.
Momentum, Another Piece of the 300-Day Moving Average
I had a professor who used to be a fixed-income and day-trader on Wall-Street tell me that when he used to trade technicals, that he was right about 51% of the time, but that he’d get so freaking stressed out over it that it literally was not worth all the additional effort. Of this he also added that you’re probably better off just trading momentum, rather than memorizing the literally hundreds upon hundreds of technical analysis factors that exist within the stock market, I’ll stick to the main dozen or so that are talked about on CNBC and Bloomberg quite frequently, at least this way when someone says “we’re sitting on a death cross right now in the tech sector of the S & P 500, a recession is upon us,” you can sit back, laugh a little bit, sip your coffee, and continue sitting on your passively managed index fund with extremely low fees, knowing that at the end of the day (the long run day) that you’ll come up ahead regardless, and that the death cross is actually nothing more than a savvy marketing ploy meant to get ad buys and make the public interested in their show. And on that note, enjoy my Technical Analysis factors “Analysis” ….if you will.
The Filter System, Another Alternative to The 300 Day Moving Average
The filter system is essentially this, a stock has moved up, say 10% or so, and is now said to be trending upwards, and vice versa, a stock that has declined 10% is said to be trending downwards. The filter system, also commonly known as the “Filter Rule” is a trading strategy where technical analysts essentially buy a stock based entirely on price momentum. It is probably one of the least accurate technical factors out there, in my own personal opinion and in that of many financial analysts, in that it is hugely arbitrary, based entirely on the trader’s own opinion of what direction a stock’s price is heading. Nowadays, a lot of this is done via algorithms and software programs, through automated, algorithmic trading processes (and is still JUST as ineffective, or almost as much).
The gist of this technical factor is that a trading percentage is usually based on a short run trend, like a price filter trigger between 1-10%, as traders choose to filter a trade when a stock rises or falls by a certain percentage. An example for a 1% filter rule, would be, to simplify this, only buy with a 1% increase in price, and only sell with a 1% decrease in price. A 1% filter rule trigger is probably more accurate than a 10% one would be, as the research on this technical analysis factor shows that the lower the percentage trigger, the more accurate that it usually is (or less inaccurate I could say, as this is definitely not the end all be all for stock price prediction models). And that’s it! Well sort of, it’s also important to know that this factor was one of the main ones that popularized the “stop loss” order that brokers have popularized so much while trading (and profited heavily in commission fees off of).
Aside from the research showing that lower percentage variations are less wrong (no duh, less percentage variations mean less margin for error…as well as lower volatility stocks, which mean lower losses typically), the research shows that, even with 1% to 50% variations in filters, after accounting for commission fees and increased taxes due to short term holdings (less than one year holdings are taxed at the ordinary tax rate, longer than one year at the capital gains rate, which is anywhere from like 0-20% depending on your tax bracket, but that will always be a lot lower than your ordinary tax rate) that you’d be better off just buying and holding the stock (or index that the stock is in) with regards to long term returns. I would personally advise you to avoid using this technical factor in your stock picks!
The Dow Theory, Better Than The 300 Day Moving Average?
As interesting as the filter system is in all its fake glory, the Dow theory is just as devious in its own right. The Dow Jones Theory of technical analysis basically says that recent highs and lows (or other major index benchmark levels for that matter, like the S and P 500 or NASDAQ) can define certain resistance levels, similar to moving averages, that can give traders a guide for when they should buy or sell the security. While this is typically done with the DOW average as a whole, since it is an extremely common benchmark, it can also be done with other stocks, ETF’s, index funds etc. Essentially what this resistance level theory states, is that if a stock breaks through a certain resistance level, it is likely to keep going up, and if it falls through a certain resistance level, also known as “failing to penetrate a resistance level,” then it is said to be on the track downward, which can also indicate the start of a bear market if this is done through a major index such as the DOW Jones industrial average or the S and P 500. Again, since this is a technical indicator, and is essentially just a slight variation of 50- and 300 day moving averages, I wouldn’t put a whole lot of weight into this one, especially since the research on it shows that the signals generated by this DOW technical have no accuracy in predicting future stock price movements. In short, this is another failed technical factor that, when it shows up on CNBC and you’re watching Friday morning television, you should chuckle at and ignore, continuing to be glad that you’re in an index fund, and not in some high risk, day-trading shorts, leave those to the guys making commission on them.
| Related Posts |
|---|
The Relative-Strength System (Also Known as “Trading the RSI Numbers”)
I actually remember this one quite clearly off the top of my head, as I remember one of my first investments classes while I was a student of Finance. The first day of class, the teacher opens up the class and says “does anyone here trade or day trade?” to which a kid towards the front of the room raised his hand at. The teacher asked “how do you trade,” and he replied “I just look at the RSI numbers and buy what’s running hot.” The teacher knew exactly what he was talking about, however since I hadn’t actually dived into my study of investment principles yet, I had not a clue what he was talking about, and upon hearing “I trade the RSI numbers” I assumed the kid must’ve been some financial, day trading genius. Nowadays, I realize that the kid was just as delusional in believing the random technical analysis bs that he read on any old finance blog on the web, as any other poor sap who listens to every word his financial advisor says as if it’s pure gospel is. By the way, to this the teacher said “okay, okay I like it. Do you think the numbers are everything, or does the actual company matter?’ to which the kid replied “oh yeah it’s all in the numbers.” The teacher, and Doctor of Finance just chuckled to himself and said “oh this is gonna be fun.” I had a feeling when he said this that he was likely going to prove him wrong, but there was also something in my mind that thought that the numbers…..just might hold all the answers.
So on that note, the RSI, also known as the Relative Strength Index, is a technical analysis indicator that tracks what is essentially momentum, either in an individual security, or in that of the overall market. The RSI number system ranges from 0 to 100, and is usually  displayed on a line graph that moves between the two numbers (between 0 and 100.) The gist of the Relative Strength Index is that if a stock is valued at higher than 70 on the RSI line, then that stock is considered to be overvalued and should be sold off before it tanks, if the indicator is below 30% (30 on the RSI line) then the stock is undervalued, and should be purchased before the stock inevitably goes up.
If you’ve already made it this far in the book, it shouldn’t take a rocket scientist to sniff out a few problems with the RSI indicator already, like the fact that one simple number, based on what is just an algebraic math formula, cannot possibly predict what a stock’s valuation is going to do in the future, and those that think otherwise will fall prey to those same historic schemes like the dot com and the South Sea Bubble that we talked about early on in this book (see I had a plan for that all along.) So how exactly is this hocus pocus, supposedly super powered technical factor calculated? The formula is as follows:
The Final Formula for the RSI
And from there you just plug and chug. The denominator in that formula (the bottom part of the fraction…don’t worry I forgot too) is the average gain/the average loss during a certain look back period, which in the case of using the RSI indicator, is typically a 14 day standard period. So, as an example, let’s say that a stock closed higher 7 out of the last 14 days with an average 1% gain. The last 7 days were all down 8/10ths of a percentage point on average, in this case, the formula would look like:
100 – [100/1+ (1%/14)/(.8%/14)] >>>>>>Which gives you a final answer of 55.55, or at least it should (feel free to double check my math and get back to me in a comment on my Finance blog if you think it’s incorrect!) Anyways, what a 55.55 score would tell you is that….basically this stock is neither in perfect striking range nor a necessary sell due to it being overvalued, most RSI technicians would likely tell you to hold onto this stock until it moves either up to 70, or falls to 30. Still, my opinion on the RSI indicator stays firm, stay as far away from it as possible, and if you want to speculate, best to do so by using the financial statements of the company and gaging their actual business practices etc. and going from there.
Price-Volume Systems, Worse Than the 300 Day Moving Average?
Price-Volume trading systems basically say that when a stock goes up or down a lot, on an increasing or decreasing volume of shares being traded, that this is a signal that a movement is afoot. So if a stock rises on increasing volume, there is basically an excess buying interest, and the stock will continue to follow this momentum indicator and move up, and if a stock falls due to decreasing volume, or a large volume of increased sells, then due to the stocks momentum, it is likely to keep falling, and should be sold, or sold short on, in order to capitalize on this fact. Now, I can get behind this technical factor a little bit more than I can just following the RSI numbers of a security, as to an extent it is based on momentum and human psychology, not that it doesn’t have its flaws. If you are feeling speculative (and I do exercise the term speculative as there is absolutely no hard science on any of this stuff), then using a price-volume system might not be an absolutely catastrophic way of doing so (better than the RSI’s that’s for sure). Still, even in this case, trading for the long term, on the fundamentals of the company, via a well-diversified, passively managed strategy, is still the way to go.
Short Interest
Short interest is one of my personal favorite technical analysis factors, in that is essentially just a measure of momentum, and even though there is plenty of evidence and research suggesting that there is no correlation between shorts being covered and a stocks price rising, it is still a cool analysis factor, at least in theory. The concept of short interest essentially says that the more short positions there are on a single security, or in the market as a whole, the more shares you should buy, as it can be a signal that eventually these short positions need to be covered (bought back, as a short position is essentially just borrowed shares) which will drive the stock price up significantly.
The simple flaw in this logic is actually pretty straight-forward if you think about it, even though this is a pretty cool technical analysis theory…if only it actually worked, in that if so many people are taking on short positions, it usually means there’s at least somewhat of a good reason, and that the stock is likely already on its way to taking a deep dive. If you’re purchasing up shares of a stock hoping that your short interest theory holds true, you may be purchasing an over-valued stock that others are shorting, waiting for it to fall straight to the center of the earth….because of this logic….short interest, as in the case of all of these technical analysis strategies, is again not a stable factor to use when trying to speculate on what a stock’s price may or may not do.
50-Day, 100-Day, and 300 Day Simple Moving Averages, Is The 300 Day Moving Average Best?
Moving averages are another favorite of mine, and are essentially just another fancy measurement of a stock’s momentum as a whole. A moving average, for instance with the example of a 50-day moving average, is the stock’s average closing price over the last 50 days, and is one of the most popular technical analysis indicators that is used on the street, as goes for the just as commonly used 100 and 200 day moving averages, which broadly are all just measures of momentum. Since, as I mentioned before, many experienced fixed income and equities traders on the street would say that momentum is actually the only thing worth trading on, this is obviously a popular indicator, in that it is probably the most likely on this list to work (even though there is still plenty of research against it to prove that index funds are still the way to go.)
The general rule, once again, for why this technical analysis factor might work, is that of momentum, or to put it in quotes, that “stocks that have been rising will continue to do so, and those that begin falling will go on sinking.” The data on testing of these theories, is less than glamorous, and in fact the data shows that past price movements cannot reliably predict long term future price movements. I will tell you one tiny secret though, not that it’s really useable because you will almost always lose out due to the transaction and commission fees that you will eat by trading on it long term, and that is that there is some evidence to show that there is some short term momentum in the stock market, ie. a stock that is falling will continue to fall etc. The reason there is a tidbit of this in reality, is that there is still momentum from crowds buying and selling, and from mass psychology (as evidenced by that of the bubbles indicated in an earlier chapter of this book) and that, to the extremes, crowds tend to feel that as a stock, or an index, is increasing, that they should buy more…pushing it up further somewhat (expansionary economic period) and that during a market fall, that they should sell out (continuing to push the market down more.) For more evidence of this on the falling side, think about why the stock market has an “unplug button” to it, if you will. Yes…you read that right, if the stock market is in free fall, a contingency plan has in fact been added, which is that they will literally unplug the computers and stop the bleeding early, as evidenced by the market closing early on 9/11, and during other black swan events.
Why exactly would they do this? Well, they know that the madness of crowds, especially after a large black swan event like 9/11, can in-fact influence the market in the short term, and they want to use this “pause button” for the stock market in order to allow the masses to fester on the event a little bit, staving off some of the bleeding and possibly even delaying economic swings (turning an expansion into a recession overnight for example due to mass panic after a black swan event). Personally, I’m a free market economics type of guy, and while if I was a politician I’d probably do the exact same thing, because I understand the ramifications of allowing such a thing to happen, and I think that this is something of an unfair cheat for long buyers that they should not be able to use. For instance, if I was a short seller (even though the market did eventually reflect all accurate available information, including those of the black swan event, but I guarantee you that it was mitigated somewhat) I’d be upset had the market closed on 9/11, and the bleeding not allowed to keep going, as I would have lost a lot of money, which would’ve been my risk premium for taking such a position. Overall, major stocks like American Airlines and other airplane companies fell as much as 40% + over the first week after the event, due to mass crowd fear from the attack, had the bleeding not been unplugged during the day of the event itself, I guarantee you on that first day it could’ve fallen as much as 35-40%.
I’ll tell you one more thing that I read about the stock market and 9/11 that was talked about during my Security Analysis class during my time studying Finance at FGCU (my teacher had been a fixed income trader in New York at the time of the twin towers coming down, and actually described the horrific event and what he witnessed to us in class one day) and that’s that, before the time of 9/11, that there was a significant increase in the number of put options being bought on airline-related companies. Now a put option is essentially just a leveraged short position, and a short position is when you’re betting against a stock, hoping that the stock goes down so that you can make money.
Quick refresh on those terms before I get to the point of the story here, in a pure short position, had I purchased Amazon stock at $1000, and I purchased the stock short at that price, and the stock price fell to $800, after a 20% fall, I would make 20% on my money (depending on margin and a few other things which will be discussed later in this book, but this is the gist of a pure short position). What a put option is, is a leveraged version of that, so lets say that I spend $1000 to buy 10 put options on Amazon while it is priced at $1000, and it has a strike price of $800 (the strike point is the price at which you can exercise your option, so I can’t use my option and profit from it until Amazon falls to $800.) Again this will be explained further on in the book, but stay with me here. Then when Amazon falls from $1000 to $800 overnight from a black swan event like 9/11, my 20% gain, with the use of options, might move up to a 100 or 150% gain depending on what type of spread I get.
With this in mind, it is scary to think that we might’ve had some insiders that were buying these leveraged short positions on particular airline-based stocks, or worse, that the instigators themselves even used the chaos to reap financial profits from the incident, however this looks like it might be the case (don’t believe me, Google search “increased put options during 9/11” because I know that this sounds very Alex Jonsian, conspiracy theory-like, far from the usual tone of this book so far). Anyways, figured I’d throw that out there, and with that I’ll end my rant and get back to the meat and potatoes of technical analysis.
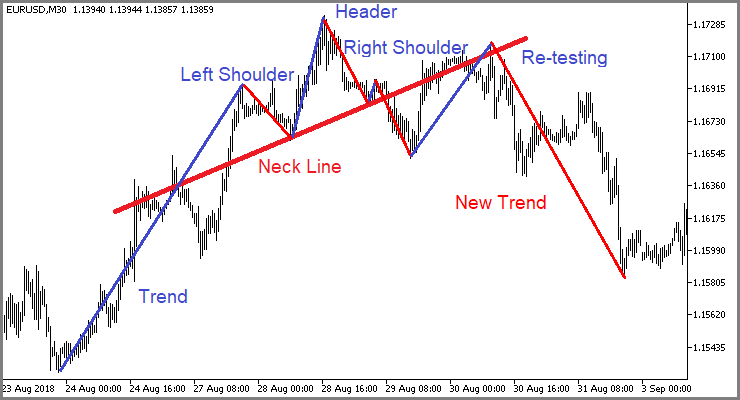
The Death Cross
Alright, so getting back to it, the death cross is another major technical indicator that you’ll see on CNBC and the Bloomberg financial news quite frequently these days, and this particular technical factor is a really good marketing gimmick on the part of the financial guys, in that the word “death” tends to really draw people’s attention. I didn’t realize the power of this type of fear-based marketing and branding on the public until I actually had a conversation with my parents about the stock market one day. They had been watching the financial news a lot and one day when I was home visiting, right in the midst of my peak financial knowledge as I was an energetic student, pounding caffeine and energy drinks day and night, grinding away learning about the stock market, arbitrage, the math and theory behind finance, and including and especially, the details of fundamental and technical analysis indicators, and of why…more often than not, that you shouldn’t pay too much attention to them, and even less to the financial pundits who shove them down the throats of the unsuspecting public in order to try and rope in commissions from the based entirely off of fear.
I noticed the effectiveness of this particular marketing ploy, being the death cross, when in the midst of a hot expansion (I think the DOW was pushing towards 29,000 at this point in time, which as of now is its historic high) my parents said, “Stephen did you see that the market is going to plunge soon.” I said “um…what’re you talking about, I think everything is a little bit over valued and that a correction is maybe afoot sometime this year, and that in the next 12-18 months that we’re likely for a recession based on the current yield curve and price multiples of most of the major benchmarks and blue chip stocks out there, but plunge…why do you say that?” To this they replied, “because of the death cross,” this is a totally true story, cannot make this up. I said, “the what cross?” and they said, “the death cross, it’s 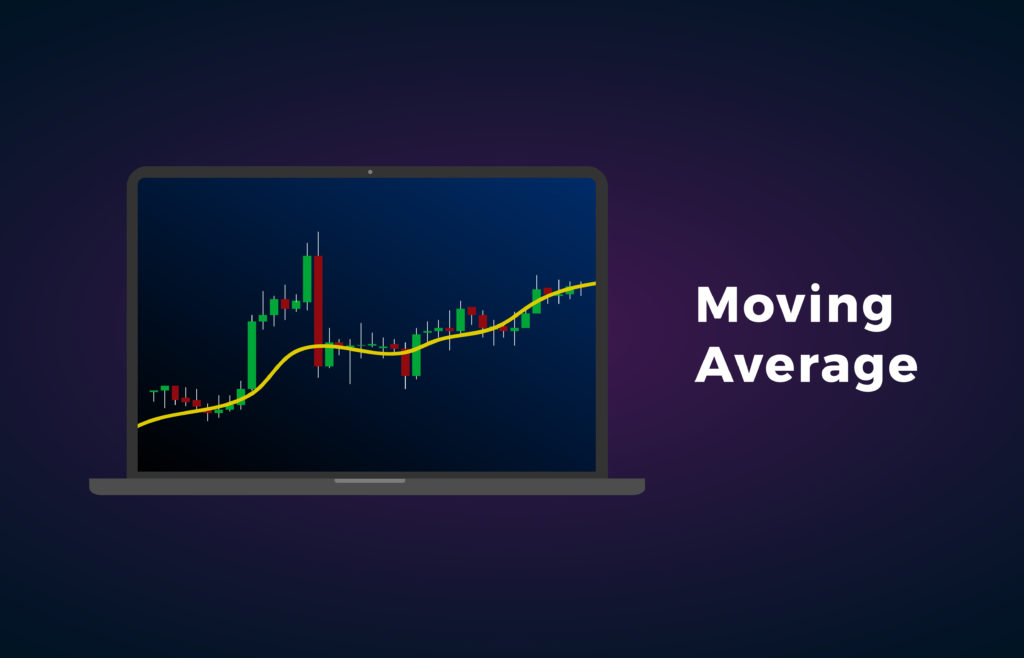 when stocks hit a certain pattern on their charts and the market is headed for a sure drop.” I shrugged and didn’t lecture them too much on this, mainly because it’s very difficult to explain to them why their thinking on this matter was wrong when they don’t know what a technical indicator vs a fundamental stock indicator is, let alone all the other things that I discuss in this book, however their thinking on this was unjustified, in that they were giving too much credibility to….first of all….the analysts on TV who have an extreme bias to get you to believe what they are selling, and second of all, to technical factors, of which really exist mostly so that analysts and brokers can sell their clients on new tricks etc. and get them to trade more frequently, gouging them on commissions in the process. So anyways…. that’s my story on the death cross…. what exactly is the death cross?
Well, if you’ll direct your attention to those two lines crossing each other, and more than once might I add, those 2 lines are the short-term and the long-term moving average of a stock, which as we stated earlier, is the average price over a certain period of time, usually over 50, 100 or 200 days. Since we’ve analyzed that technical factor in vivid detail also, we know that the death cross is basically just an overzealous measurement of momentum. The technical factor is supposed to indicate the potential for a major sell off, in that the short-term average is essentially “crossing” below the long-term average of the stock. This is mostly just a bunch of nonsense and shouldn’t be taken overly seriously if the Telly keeps throwing it in your face every time you turn the TV on. (The contrast for this is the “golden cross” which is the reverse of this, and supposedly indicates a bull market approaching.)
The Super Bowl Indicator
This is the funniest one I’ve seen so far, in that it is literally a perfect example of “correlation does not equal causation,” especially when the correlation is really low. When I went online to do further research on this technical analysis factor for this book, most of the websites out there actually say that this is a “superstition” rather than a technical analysis indicator (after reading this chapter and my viewpoint about technical analysis and the types of people that boast about it…. let alone believe in it, you’re probably thinking to yourself “what the heck is the difference anyways”) which pretty much sums up the validity of the theory. The Super Bowl Indicator was actually spot on for quite awhile, having an almost 90% success rate for a time, it was coined by an ESPN sports writer after a big football game, and the financial media caught wind of it and used it for more traction and views.
The Super Bowl Indicator is based on the theory that a Super Bowl win for a team of the AFC is foreshadowing of a decline in the stock market for the coming year, while a win for the NFC is foreshadowing a bear market for the coming year. There is absolutely no real evidence, other than that this indicator was right for some time, nor is there any sort of reasoning that comes close to logical reasoning to prove that this indicator is right (no momentum or crowd psychology rationale, etc.). The indicator also counts the Steelers as being in the NFC, since they originally started in the NFL division before moving over….so by that logic it seemingly isn’t so right after all. The one thing that this does shed light on, is that two totally unrelated events can sometimes seem correlated. They also found a correlation between the S and P 500 and the volume of butter production in Bangladesh that was even more “accurate” than the Super Bowl Indicator, in short….this one’s a dud, stay away from this one or you’re just tossing away cash!
The January Effect vs The 300 Day Moving Average
Being that it’s February currently at the time of me writing this chapter, and that the stock market this year skyrocketed during the month of January, my more animal instincts and human biases make me want to draw a correlation between the January Effect, and it being right this time around, however…I know that the hard research indicates otherwise, and that the January effect is definitely not something that you can rely on with sufficient accuracy year after year. The basic premise of this technical indicator is that the stock market has tended to rise especially in the first 2 weeks of January year over year over year, and that over the course of the month, it also tends to rise, with this effect being even stronger for individual firm’s stock prices.
There has been a lot of media coverage about this particular indicator currently and in the past, however the final verdict on using this indicator to actually profit off of it, is that it has red flags on two fronts. First of all, yes, there likely is some small amount of momentum each January, people tend to want to “change their lives” as a new year begins, and as such there is some mass psychology that contributes to this momentum, as well as the combination of this with holiday shopping, with stores giving New Years discounts, and with about a hundred other things. The very fact that this is a well-known technical indicator also gives some premise to the idea that…because people think that the market will go up in January, they behave as such, buying more stock etc. and giving way to the actual execution of the indicator being successful. Still, the research leans towards showing that the momentum boost each January, whether in the first two weeks or throughout the course of the month, is so infinitesimal that it’s just about impossible to take advantage of it after accounting for increased short-term taxes and commission fees from your broker. Once again, as with the rest of these technical indicators, this is one to stay away from, hold the passively managed index fund and go on with life! In comparison to the 300 Day Moving Average, at least for market timing, I would pick the January Effect every single time!
The October Effect
I’ll close out this technical analysis chapter with the October effect, mainly because I wanted to get all the primary seasonal technical indicators in this book, and because after about 6000 words of listing technical analysis factors and explaining why the research claims they don’t work, yada yada yada, I’m bored of writing about this topic and am ready to move on to bigger and better things (onward to fundamental analysis!)
The October Effect refers to the tendency of the stock market to fall in October, literally just because that’s what happens, and because of a lot of the same reasons as that of the January Effect causing the market to potentially rise in the first two weeks of January. This looks to be mainly a psychological phenomenon that occurred do to the random swings of fortune causing the market to randomly fall in October historically, and, once again, because of mass psychology and the madness of crowds thinking that the indicator works, acting on it, and therefore bringing the thing into fruition due to the fear of it working, ie. selling off their stocks more, etc. If there is any slight negative momentum in October of the stock market, as is true with any slight positive momentum in the month of January, it is likely almost impossible to exploit due to the excess taxes and broker fees that you’ll accrue due to short term trading on it.
There is also the additional red flag, with both the October and January effect, that says that, if this technical factor is out there, even if it DID work, because of luck or some great alien out in the cosmos, or the madness of crowds, or political rigging, or any other of a million possible reasons for this happening, that the very fact that it works would make it become known, which means that many people will know it, which means that so many people will know it, that with the stock market being efficient, that it will correct for this arbitrage anomaly, and will render it useless, null, and void. Once again, stay away from this one, and keep on trucking with your well-diversified, passively managed index fund, never deviating whether it’s the January Effect, the October Effect, the September Effect (made this up) the Wednesday Effect (made this one up too) or the Easter and Christmas Effect (#sarcasm for the win). In the end, the research and my own personal learnings and experience, say that over the long run, you’ll win the annual rate of returns game, which is really all that matters.
A Rough Analysis of Technical Analysis, Why The 300 Day Moving Average Works
And so to close out this chapter on Technical Analysis, and why you likely shouldn’t use it, I just wanted to say that the reason I listed like 20 of these technical indicators, and of why I tried to go as in depth as I possibly could on them without falling asleep, or putting you to sleep in the process (hopefully) is because I know how commonly these come up among stock brokers, among financial advisors, among news media anchors on Bloomberg who are trying to pitch the masses on a stock or an index fund, how often guests being interviewed on the news use these technical analysis factors in their rhetoric (like in the case of the story on “The Death Cross” that I told) and I want to make sure that after learning Everything You’ll Ever Need to Know about Finance, that you really do know everything that you’ll ever need to know and them some, and that you are educated in the face of these blood thirsty monsters that are trying to be disingenuous and pick the pockets of the public with their fancy finance terminology.
Final Thoughts on Technical Analysis And The 300 Day Moving Average
And now, after having read this chapter, you are one step closer to being armed against the masses, against falling prey to bubbles, against being manipulated into making rash stock picks or day trading based on the tales of the mainstream media, and all the other trap doors that you can easily fall into in the confusing world of investments and high finance. I hope that this chapter was at least somewhat interesting for you, and that you will also find the next chapter, on fundamental analysis very interesting. Fundamental analysis is very real, and I am a big believer in it (I think there may even be some deviation tricks that you can use to increase or decrease exposure from just the buying and holding a passively managed index fund terminology, even though they are definitely slim and you will want to know the risk that you are taking by using them). In the next chapter, we’ll look at some tricks from Warren Buffet regarding fundamental analysis, we’ll run through what is actually in a 10-K and how you can read a companies financial statements, and a whole lot more, enjoy!
Sources:
https://money.cnn.com/data/markets/
Disclaimer: The opinions and documentation contained within this article and on this blog are the sole property of inflationhedging.com and are not to be copyrighted or reproduced in any manner, else legal action within the rights of the United States legal code could be use to obtain recompense. All articles and blog posts are the sole opinions of the writers of the blog, and are not necessarily in line with what exactly will work for you, you should consult a CPA, Tax Professional, or Financial Professional to determine what exact financial needs are in line with your interests. Also, from time to time, certain links on this website will be used to generate affiliate commissions, in order to support the health and growth of our website, health and business.

Leave A Comment